Blog Post
EU recovery plans should fund the COVID-19 battles to come; not be used to nurse old wounds
In its proposed Recovery Fund, the European Commission uses allocation criteria mainly linked to infection rates and past economic performance. To foster an efficient economic rebound post COVID-19 crisis, we propose instead to allocate funds through a forward-looking approach based on specific industrial and economic structure of EU regions.
EU countries are engaged in difficult negotiations over how to allocate a recovery package of some €750 billion to help countries and regions recover from the COVID-19 shock. This raises fundamental policy questions. Should the EU favour countries or regions most affected by the COVID-19 epidemic? Using which criteria: death toll, economic impact?
The COVID-19 epidemic had very different impacts on different EU countries and regions. Death rates ranged from more than 800 per million inhabitants in Belgium; 500 to 600 in Sweden, Italy and Spain; around 400 in France and the Netherlands, then down to some 100 in Germany, and fewer than 50 in many eastern European countries and Greece. These numbers mask even greater differences within countries. For example, 48% of all Italian deaths occurred in Lombardy, with a rate of 1,600 deaths per million inhabitants, while the south of the country recorded mortality rates similar to Greece’s. The situation is comparable in France and Spain when we compare the Paris or Madrid metropolitan areas (1,160 and 1,300 deaths per million inhabitants, respectively) to the majority of those countries’ regions.
However, the economic impact of COVID-19 has been highly variable. The European Commission predicts an average fall in GDP growth rates of 7.4% for the European Union, with a relatively narrow standard deviation (1.3; coefficient of variation of 0.18). In contrast, the coefficient of variation for COVID-related deaths is seven times larger (1.27). High frequency data is consistent with this reading: the change in weekly electricity consumption (from 2019 to the same week of 2020) indicates that countries, such as Italy, that started first with a harsh lockdown, gradually lost up to 30% of electric power actual load. By mid-April, however, this figure was essentially similar in countries with less harsh lockdown/contagions, such as Germany. All countries then rebounded together as soon as the lockdown was released.
Therefore, should the economic impact even be taken into account in the criteria to allocate the recovery fund, considering it seems to be more homogeneous across the board? Moreover, if we consider only economic consequences, should we look at the past performance of a country or region as a predictor of future performance, as the Commission seems to suggest implicitly in its proposal on the allocation criteria? Or should we have a forward-looking approach?
In order to contribute to this debate, we try to assess to what extent the COVID-19 shock might affect EU countries and regions in the near future, by looking in detail at how industrial and employment structures differ between them. To do so we built and combined two specific indicators measuring the exposure of EU regions to external and internal COVID-19 shocks.
The exposure of EU regions to external COVID-19 shocks
First, we built an ‘external disruption risk’ indicator (EDR). This captures the vulnerability of EU countries and regions to COVID-19-induced shocks on global value chains that restrict the availability of inputs for production, or the possibility to sell output on global markets.
Considering the restrictions on international trade, we employed recently available data on global value chains to look at how much the value added exported by each industry is exposed to global trade, in terms of both how much domestic production relies on imports, and how much of it is exported abroad. We then combined these data into an external disruption risk indicator (EDRI) at the regional level.
We assumed that obstacles to the free movement of goods, services, capital and people will be completely removed within the EU over the next weeks, and thus we focused our analysis on extra-EU trade. Our EDRI derives from the combination of industries’ GVC exposure with the industrial structure of each NUTS-2 region. It tells us how much the economic structure of each region (or country) is going to be affected by obstacles to extra-EU trade. For details on the construction of the index, a number of robustness checks as well as a discussion on the weights used to build the indicator, see the Technical Annex.
Figure 1 shows the indicator at the NUTS-2 level.
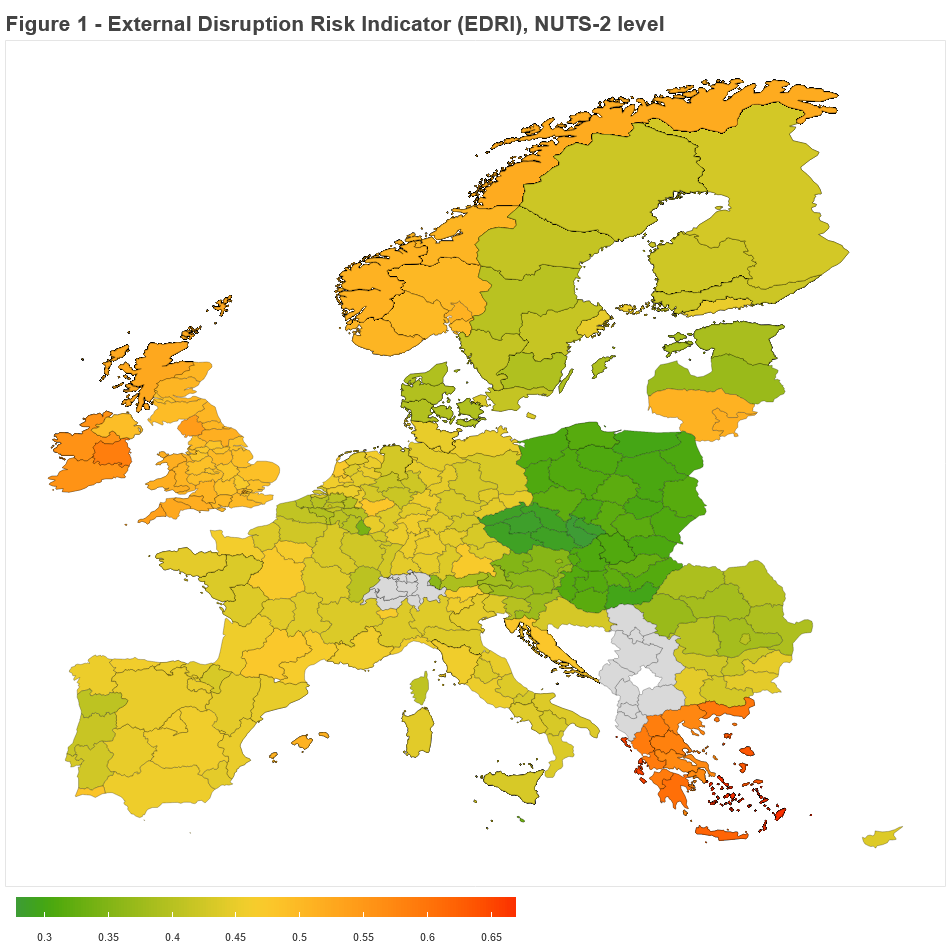
This indicator mean value is 44% with a standard deviation of 0.07, meaning that more than half of the trade of EU regions happens within the European borders, and that there are substantial differences between regions. Nevertheless, some specific regions are much less reliant on extra-EU trade, such as eastern EU regions (in green on the map), while others are significantly more exposed to these flows, such as Greece (in red). This is mostly due to the large portion of employment in construction and accommodation services, as those industries are very exposed to extra-EU trade according to the data.
EU regions’ exposure to internal COVID-19 vulnerabilities
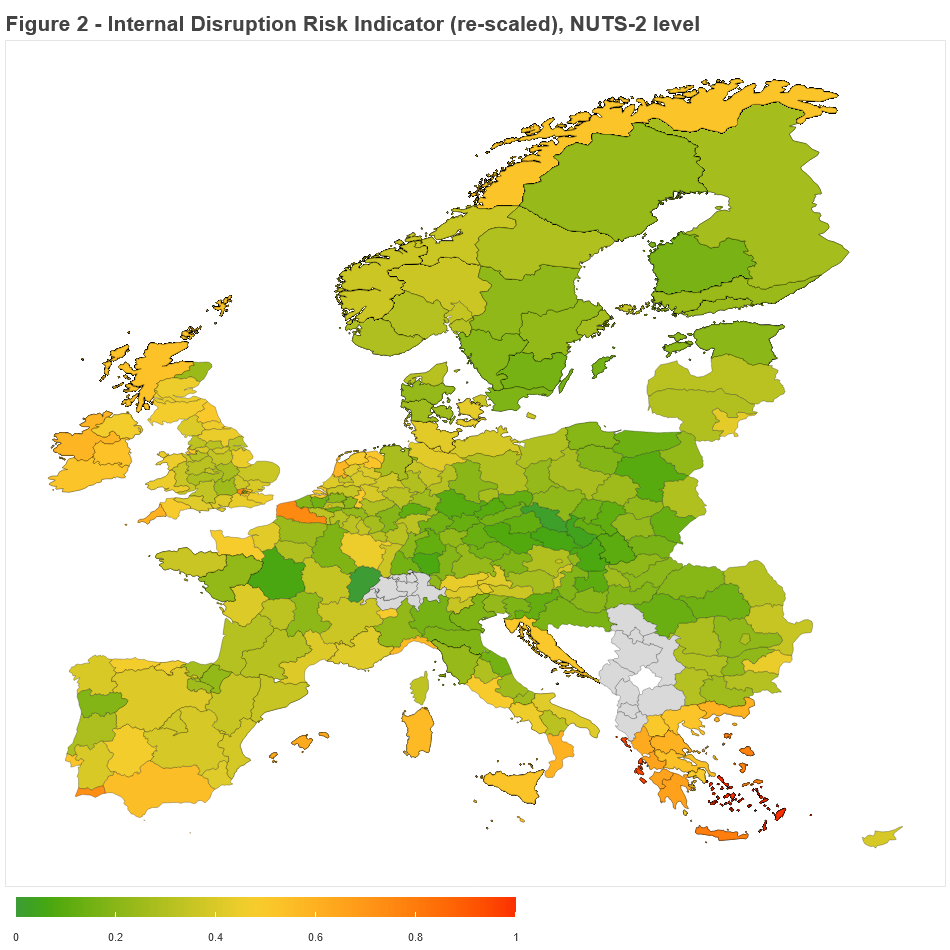
Regions’ production processes are also exposed to internal vulnerabilities caused by COVID disruptions. These arise mainly in the production function as a result of impending new safety standards (think for example at restaurants or transports). To gauge this very variable picture across industries, we constructed an indicator of exposure to ‘internal disruption risk’ (IDR). This indicator measures the extent to which the economic structure of each region or country is going to be affected by obstacles to the production process (see Annex for details). It gives a different picture of the situation than the EDRI.
Figure 2 shows the distribution by regions of a 0-1 rescaled indicator (see Section 2 of the Technical Annex for all the details). The regions with the highest level of risk (in orange/red) are mostly in southern Europe, for example the Balearic or Greek Islands. Manufacturing-intensive regions are less exposed to social-proximity risks, given the possibility of adopting social distancing measures.
The combined external and internal exposure of regions to COVID-19
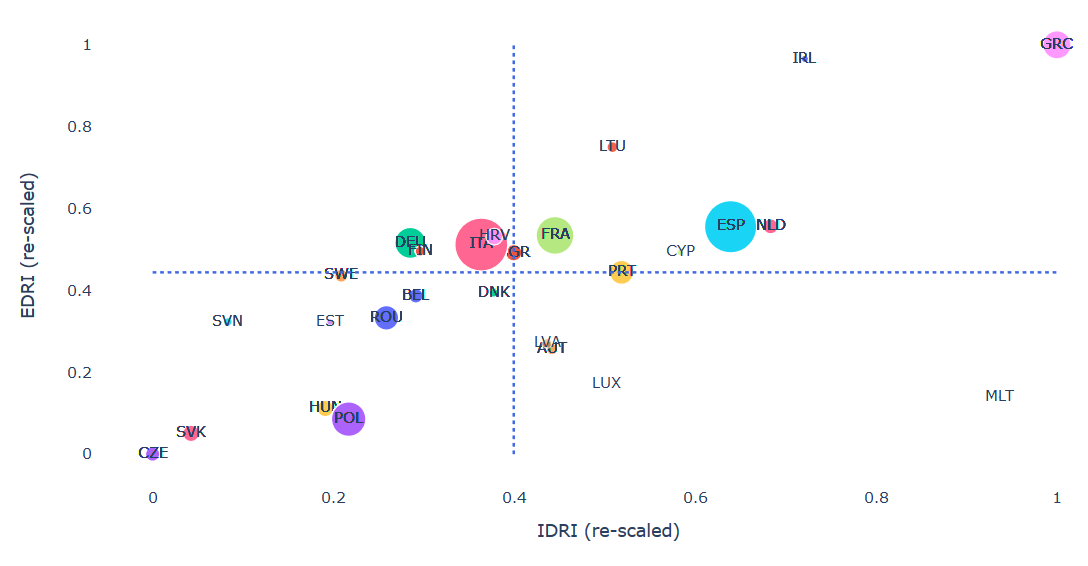
We now combine the EDRI and the IDRI in an aggregated chart in which each region is in a scatterplot in terms of its combined exposure, comparing it to the median values of the EU indexes.
We also consider data on the number of contagions up to 29 May 2020 in 225 out of 296 EU regions. We created the relative measure of contagions by dividing the number of cases by the total population in each NUTS-2 region, and then re-scaled this measure to the 0-1 interval using the EU-level distribution. Data about the total population come from Eurostat. For completeness, Figure A5 in the Technical Annex shows the regional distribution with the absolute number of contagions.
Figure 3 is interactive and plots a bubble chart for the NUTS-2 regions of the four biggest EU countries: France, Germany, Italy and Spain, while an interactive version of the chart including all EU countries and regions is available on GitHub. The size of the bubble is the relative number of contagions (re-scaled). The two axes represent the re-scaled extra-EU trade exposure and social proximity risk measures that we have described above.
Figure 3 – NUTS-2 Combined Risk
The dashed lines represent the median levels of the two indicators at the regional European level. The graph shows how regions that were hit relatively more strongly by the COVID-19 pandemic in terms of contagions (the larger bubbles) are not necessarily those more exposed externally or internally to the economic consequences of COVID-19. Regions in the right bottom and top quadrants are southern EU regions, relying on tourism and proximity-based activities. Regions in the top right quadrant are also those whose trade consists of a significant portion of extra-EU activities.
For example, the Balearic Islands could be very much affected by the pandemic despite not having had a large number of contagions. In line with our predictions, recently Ibiza clubs started cancelling or significantly reducing the traditional concert and entertainment summer season, which attracts millions of tourists every year. The tourism-related activities account for 75% of the region’s income, so it is easy to understand how the pandemic could have a large impact on this type of economy. Other examples of regions in this quadrant are Provence-Alpes-Côte d’Azur in France, Madeira in Portugal and Berlin in Germany. Many touristic regions are also at the border between the top-right and bottom-right quadrants, including Calabria and Sardinia in Italy, Brussels in Belgium, Cyprus or Martinique in France. Many of the regions that were severely hit by the COVID-19 pandemic are in the left part of the figure, for example Lombardy, Bavaria and Ile de France. Lombardy is at the border between the top and bottom left quadrants, since its industrial structure has a large manufacturing component and this region has a relatively higher share of trade with EU rather than non-EU partners than other regions. Examples of regions falling in the bottom-left quadrant are the Silesian province in Poland, which is an industrial region where manufacturing accounts for the largest share of employment, or Oberosterreich, Austria’s leading industrial region.
Conclusion: regionalising the recovery and resilience EU allocation
A ‘forward-looking’ approach to evaluating the potential economic impact of the COVID-19 pandemic, based on indicators of the exposure to internal (EDRI) and external (IDRI) disruption risk, can lead to very different outcomes than those implied by standard metrics such as past economic performance or exposure to contagions.
Therefore, in order to tailor a more consistent and effective allocation of EU recovery money, policymakers should consider the intrinsic differences of EU regions in terms of industrial and employment structures, because such differences are going to determine the future local impact of the COVID shock.
In his estimate of the cross-country allocation of the funds proposed by the EU institutions as a recovery tool, Darvas (2020) showed how the proposal implies both an insurance element (countries hit harder get more EU funds) and a redistribution element (countries with lower GNI per capita get more EU funds). How would such estimates change if our ‘forward-looking’ indicators were taken into account?
Figure 4 reproduces Figure 3 at country level, using weights covering the same sectors as in the regional exercise (see the Technical Annex for a similar chart using alternative weights as robustness). This time however the size of the bubble corresponds to the potential country share of allocated funds according to the EU Commission estimates. If our ‘forward looking’ indicators are considered an additional criteria for redistribution, we should expect to see the relatively larger bubbles (i.e. the countries benefitting most from the allocated funds) in the upper right quadrant, i.e. where both the external and internal exposure is higher than the EU median. While this is partly true for Greece and Spain and, to a somewhat lesser extent, for France and Italy (as they are close to the EU average in terms of potential shock), the positioning of other countries seems to be at odds with the proposed allocation of funds. In particular, some of the potentially mostly hit countries are not benefitting proportionally (e.g. Ireland), while others appear to be disproportionally funded (e.g. Romania, Poland or Hungary), because of the allocation rules based on past economic performance (in particular the 2015-19 unemployment rate).
Figure 4 – IDRI/EDRI and EC share of allocation
In any case, whatever the chosen criteria of allocation, the country-level view can be misleading, in light of the strong regional differences within countries. This is especially true in countries such as Italy and France. An approach to the allocation of EU funds informed by our indicators would instead allow for an intervention that is consistent over time and space: it considers the future inherent trade and production risks embedded in each region’s industrial structure, as well as the differences in regions’ industrial structures.
Our study is not free of limitations, the most important being the reliance on SBS employment data for constructing regional weights, an issue that has limited the sectors covered in our analysis (see Section 3 of the Technical Annex for a detailed discussion). Nonetheless, our analysis shows the need to think more broadly about the spillover effects of the pandemic, which are also spreading to regions only marginally hit by the virus. A forward-looking approach based on industrial and economic structure could ultimately help better understand the relevant regional impacts of the pandemic, above and beyond contagion rates and previous economic performance. The recovery funds should not be seen exclusively as medals for the past battles of the COVID-19 campaign, but rather also as precious ammunition for the battles to come.
The Annex is downloadable here.
Republishing and referencing
Bruegel considers itself a public good and takes no institutional standpoint. Anyone is free to republish and/or quote this post without prior consent. Please provide a full reference, clearly stating Bruegel and the relevant author as the source, and include a prominent hyperlink to the original post.