Bruegel datasets
Bruegel electricity tracker of COVID-19 lockdown effects
Last update: 29/11/2021
Data on the real-time economic effects of the COVID-19 crisis is hard to come by. However, much economic activity is heavily dependent on the use of electricity. Information on changes in demand for electricity can therefore provide some insight into the impact of the COVID-19 pandemic and associated lockdowns.
In the figures, we compare differences in electricity consumption between 2020 and 2019. We try to provide an overview of what is occurring across Europe as well as other global regions, with data updated daily as new information emerges.
Figure 1 shows the evolution of peak-hour electricity consumption in European countries since the beginning of March.
We focus on peak-hour consumption (08:00-18:00) because this is when most economic activity would normally take place. We consider only working days, ignoring weekends and removing any public holidays from the sample. Each week in 2020 is compared with the corresponding week in 2019. Week 1 is 2-6 March 2020, compared to 4-8 March 2019, and so forth (Table 1). All data is adjusted for temperature differences between the two years (see below for methodology). To compute the displayed percentages, we divide temperature-adjusted average actual total load (electricity consumption) between 08:00-18:00 by value from the corresponding week in 2019.
Our interactive global electricity tracker allows visualisation of weekly averages across all the countries and regions for which we report data. The user is free to interact with the table below, adding and comparing whichever regions are prefered.
We also computed daily temperature-adjusted averages. Figure 2 shows the daily evolution of electricity demand for individual countries.
Methodology
Other underlying factors influence demand, in addition to COVID-19. Temperature is perhaps the most important. In particular countries, a significant share of space and water heating/cooling is electric and one would expect significant fluctuations depending on daily temperatures. We therefore adjust average peak values from each year by the temperature differential.
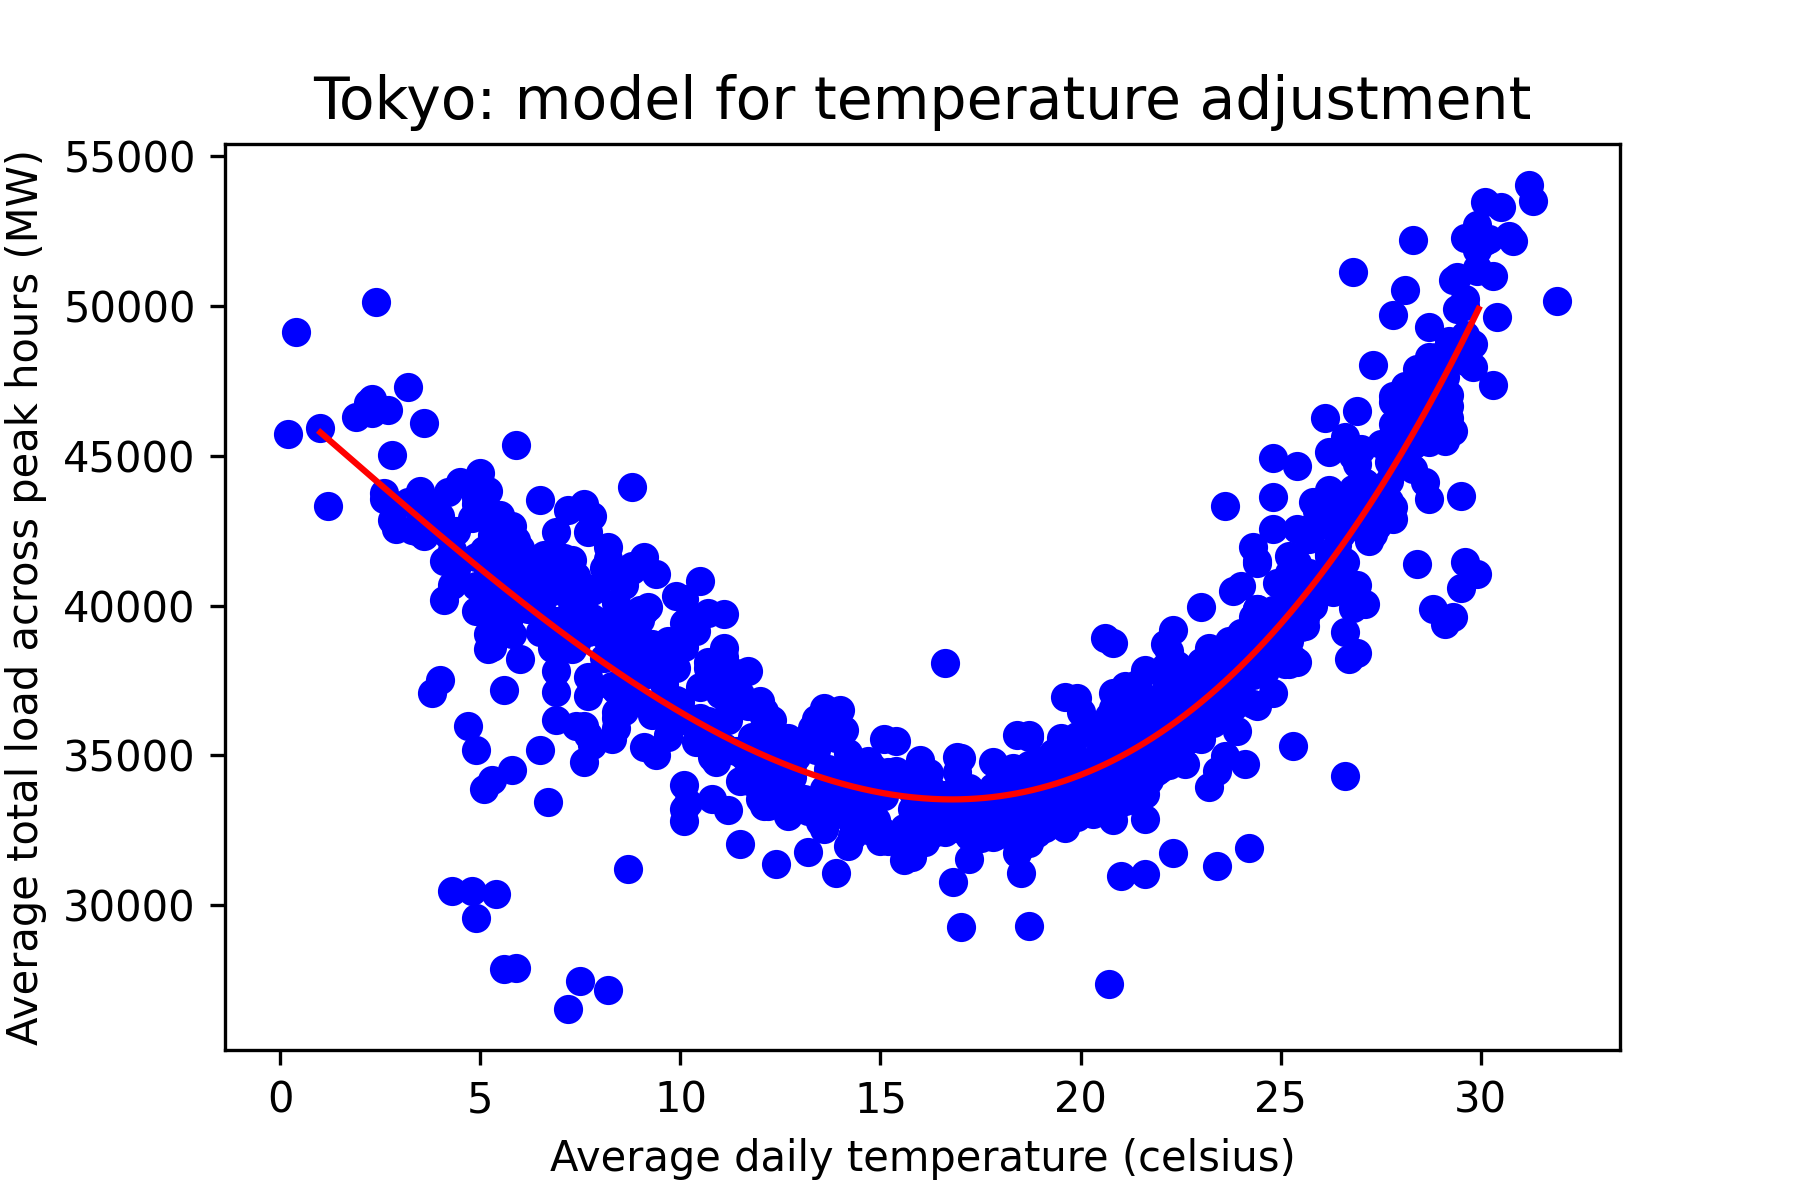
To do this, we use a polynomial function to estimate the relationship between electricity load and temperature for each country or region considered. We build a model using temperature and average load data from each country/region across the years 2016 – 2019.
This can be represented with a figure like the example provided below for Tokyo. The scatter graph represents average daily load across peak hours for the years 2016-2019 plotted against the respective temperature. The fitted function (red line) is used for temperature adjustment. Using the function we adjust values for 2020 according to the temperature differential with respect to 2019 and then calculate ratios based on this adjusted value.
National temperature data is taken from the National Centers for Environmental Information. In some cases, our most recently listed data (e.g. two days) might be adjusted for temperature using https://www.timeanddate.com/weather/ if the relevant numbers have not yet been uploaded to the National Centers for Environmental Information (NCEI). As soon as they are made available we update with the NCEI temperature numbers.
One complication that arises from our data is that entso-e, and other transmission system operators, provide the actual total load on the transmission grid. This means that any generation produced within distribution grids or “behind-the-meter” appears in the data as a reduction in demand. Given that we compare 2020 to 2019, the difference this makes should be largely removed. However, for certain countries, there may have been slight increases in distributed generation year-on-year. This would exert a small downward pressure on presented ratios. The effect may be larger on particularly sunny or windy days when solar panels and wind turbines within distribution grids produce a larger share of overall consumption. Slight disturbances to day-to-day variation may thus result. It is more unlikely that weekly reported figures would be influenced by this.
Comments and suggestions are welcome. Please send your comments to [email protected].
Recommended citation:
McWilliams, B. and G. Zachmann (2020) ‘Bruegel electricity tracker of COVID-19 lockdown effects’, Bruegel Datasets, first published 25 March, available at https://wordpress.bruegel.org/2020/03/covid-19-crisis-electricity-demand-as-a-real-time-indicator/
Data Policy: This page provides a number of Bruegel datasets for public use. Users can freely use our data in its unchanged form or after any transformation for any purpose and can freely distribute it, provided that proper attribution is made to the source, but not in any way that suggests that Bruegel endorses the user or their use of the data.