Blog Post
How has COVID-19 affected inflation measurement in the euro area?
COVID-19 has complicated inflation measurement. Policymakers need to take this into account and should look at alternative measures of inflation to understand what is actually happening in the economy.
It might seem minor alongside the huge damage to people and economies done by COVID-19, but one of the consequences of the pandemic has been to throw into disarray the measurement of inflation. Eurostat’s final estimate for inflation in the euro-area in January 2021 showed the biggest increase for a decade, from -0.3% year-on-year to 0.9% between December 2020 and January 2021, essentially due to one off factors. But while this attracted the most attention, the new composition of the consumption basket that will be used to calculate the price level throughout the year 2021, also published on 23 February by Eurostat, attracted much less. This yearly change usually goes unnoticed because consumption patterns evolve slowly. But the pandemic has changed consumption patterns dramatically.
How are changes in consumption patterns taken into account in price indices?
In the euro area, inflation is measured by the Harmonised Index of Consumer Prices (HICP), which tracks the evolution of the price of a specific basket of goods and services reflecting consumption patterns of European households. The composition of this basket (the relative quantities – or weights – of its components) is revised at the beginning of each year (in February, at the same time as the release of the final estimate for January’s inflation number) to account for changes in consumption habits during the previous year. After that, weights are left unchanged until the next update twelve months later.
This means that the quantities used in the calculation of the HICP are those of the baseline observation, not the quantities actually consumed at the date at which inflation is measured[1]. Provided that consumption patterns evolve slowly, as they usually do, this is not a significant issue in practice. Despite the slowness in taking into account behavioural changes, this method is used across the world to measure inflation. One of the main reasons is practical: precise consumption data is difficult to gather in real time. In Europe, national accounts data is the gold standard for consumption behaviour and thus for computing inflation weights. But final national accounts statistics for any year are only fully available in September the following year, well after the February deadline for publication of inflation weights. Therefore, the weights that are meant to be representative of the consumption patterns of the previous year (t-1) are, in practice, actually primarily based on national accounts statistics of the year before that (t-2). However, EU rules require member states to update expenditure shares for year t-2 to make them as representative as possible of consumption in year t-1.
[1] This makes the HICP a Laspeyres index, meaning that quantities are those of the baseline observation, as opposed to a Paasche index in which quantities are those of the date for which inflation is measured. In other words, while a Laspeyres-type index measures the evolution in prices between t-1 and t of quantities consumed in t-1, a Paasche-type index measures the changes between t-1 and t of quantities consumed in t. Formally Laspeyres and Paasche price indices for date t with date t-1 as base year are calculated the following way: Laspeyres-type index: 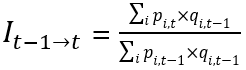 ; Paasche index:
 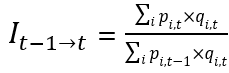 . As long as consumption patterns evolve slowly, Paasche and Laspeyres index do not lead to very different results in practice. This being said, a Laspeyres index will theoretically slightly overstate inflation because if cannot capture the fact that individuals substitute towards cheaper goods (while the opposite effect affects a Paasche index that will theoretically slightly understate inflation). Imagine that oranges and apples have the same weights in the inflation measure. If the price of oranges increases and the price of apples decreases, individuals will tend to consume less oranges and more apples, increasing the relative quantity of apples in their basket. In other words, if apple and oranges are seen as suitable substitutes, individuals can reduce the inflation they face by consuming less of the most inflationary goods.
What happened during the COVID-19 crisis?
Updating expenditure shares is usually straightforward, but additional work is required when consumption patterns face brutal shocks, such as those brought about by the lockdown measures, sectoral shutdowns and shifts in preferences that occurred in 2020. To account for these significant changes, EU countries may use “any available and relevant information from household budget surveys and other data sources […] to obtain subclass expenditure shares” (Implementing Regulation (EU) 2020/1148).
European Commission guidelines on this were complemented in December 2020 by additional instructions from Eurostat, which invited national statistics institutes to, at least, re-estimate the expenditure shares of goods and services most affected by the crisis (fuels, passenger transport, recreational and cultural services, package holidays, restaurants and hotels). Eurostat suggested that the shocks observed during the first three quarters of 2020 (for which data is already quite complete) could serve to estimate consumption during the last months of the year. For instance, INSEE, France’s Statistics Institute, increased the granularity of quarterly accounts and even used retail sales indices to estimate 2020 consumption patterns.
Eurostat used these adjustments in calculating the HICP weights published in February. These HICP weights are supposed to be representative of consumption patterns in 2020 and will be used throughout 2021 to measure inflation. Figure 1 shows how the weights of the main HICP components have changed each year between 2018 and 2021. For instance, while the relative weights of food and alcoholic drinks increased by more than 12% this year, the relative weight of transport decreased by 11%, while restaurants and hotels decreased by more than 25%. Figure 2 shows these numbers for a specific selection of items of which consumption was strongly affected by the pandemic. While the weights for personal computers, bicycles and internet provision services increased significantly, those of flights and package holidays decreased by nearly 60%.
It was recognised early in the pandemic that weights used in official inflation numbers were not representative anymore because of massive changes affecting consumption behaviours. Restaurants were closed across Europe, as were most non-essential stores. Despite falling prices, consumption of gasoline and air transport decreased dramatically, some services were not consumed at all because of sectoral restrictions, while other goods (such as hand sanitiser and face masks) were suddenly in very high demand. In other words, the basket of goods and services used to measure inflation had little to do with actual consumption expenditures.
This led to concern that official numbers would significantly underestimate inflation. For the United States, Cavallo (2020) used credit and debit card transaction data to show that using real-time COVID-19 consumption baskets indeed increased both headline and core consumer inflation. He found that updating the consumption basket increased the inflation rate from 0.35% to 1.05% in April 2020 and from 0.13% to 0.95% in May.
Now that we know more about consumption patterns in 2020, another method to check how overestimated the fall in inflation was in 2020, without resorting to alternative real-time data, is simply to compute an ex-post measure of inflation and compare it to the official euro-area headline HICP inflation. This is what we do in Figure 3: for each year t, instead of using the official HICP weights, we construct the ex-post measure by using the weights published the following year, t+1, which are meant to be representative of consumption patterns in year t. For instance, for 2020, we used the weights published in February 2021 that take into account the COVID-19 consumption shocks. For 2019, we use weights published in 2020, and so on[2].
[2] Essentially, we are comparing a Laspeyre index (the HICP) to a Paasche index (ex-post Inflation).
Figure 3 confirms that, when in 2018 and 2019 there were no sudden and large changes in consumption, both measures are virtually equivalent. But as soon as restrictions to counter the pandemic were put into place, the measures began to diverge and headline HICP inflation has remained below our ex-post measure by between 0.15 and 0.3 percentage points since the start of the pandemic (a smaller magnitude than computed with real-time data by Cavallo, 2020, for the US[3]). In other words, while methodological choices related to the computation of the HICP appear to make little to no difference to the final inflation numbers in ‘normal’ years, during a pandemic (or any other consumption shock), these technical choices have some impact on the measurement of inflation.
[3] This is in part due to the fact that Cavallo uses real time monthly quantities to calculate its index during the worst phase of the crisis, while we use constant weights during the whole year 2020 representing the changes that have taken place on average during the year not only during the most acute phase of the lockdowns.
What does that mean for inflation in 2021?
The implications for inflation measurement in 2021 of the updating to make them representative of 2020 consumption patterns are unclear.
The problem of rapidly outdated weights in the consumption basket could arise again – in reverse – at some point in 2021 if the economy reopens fully and spending habits revert to pre-pandemic patterns. Restaurants re-opening fully and flying becoming as easy as it was before could lead to some pent-up demand in these two sectors, which could lead to an increase in their prices, which would again be underestimated in the official inflation number because weights have been reduced in the meantime. There is therefore every reason to believe that the disconnect observed in 2020 between headline inflation and inflation measured ex-post could persist, and that the updated consumption basket will again become outdated.
Conclusions
First, it is important in highly uncertain circumstances to treat headline inflation numbers with some scepticism. However, even though the measurement of inflation was inaccurate during the pandemic, with inflation underestimated, our ex-post measure suggests that the magnitude of the mismeasurement was not high quantitively and that the direction of inflation – a drop – was right, which should therefore not lead to gross policy errors.
Second, even though it is incumbent on statistical institutes to take into account changes in consumption patterns if these changes are persistent, given that behavioural changes only appear after one year in the measurement, if the change in patterns is supposed to only be temporary and lasts less than a year, statisticians could simply keep weights unchanged over the whole period. This would mean not repeating the same error with unrepresentative weights for two years in a row.
Finally, as far as monetary policy is concerned, even if the magnitude of the measurement inaccuracy so far has not been large enough to lead to policy errors, central banks should keep an eye on alternative measures (such as INSEE’s ‘nowcasting’ approach, or inflation measurements based on credit and debit card data), in order to avoid losing touch with what is actually happening in the economy (the European Central Bank is clearly aware of this issue, discussing it most recently in October 2020, but we could not find any reference in the monetary policy accounts to the use of alternative measures of inflation to overcome that problem). More generally, central banks should continue to look beyond temporary changes and focus on the medium-term effects that the pandemic might have on inflation through a persistent increase in slack if the economy does not recover rapidly and does not return to its pre-crisis trend.
Recommended citation:
Claeys, G. and L. Guetta-Jeanrenaud (2021) ‘How has COVID-19 affected inflation measurement in the euro area?’ Bruegel Blog, 24 March
Republishing and referencing
Bruegel considers itself a public good and takes no institutional standpoint. Anyone is free to republish and/or quote this post without prior consent. Please provide a full reference, clearly stating Bruegel and the relevant author as the source, and include a prominent hyperlink to the original post.