Blog Post
Austerity Tales: the Netherlands and Italy
Austerity might be driving the eurozone into a debt-deflation cycle, as higher debt and deflation feed off each other. Earlier this year, the ECB viewed the dip in inflation as temporary. Even now, ECB officials regard deflation to be unlikely. And the safeguards that they are glacially moving towards take a eurozone-wide view rather than differentiating across countries. Yet, the analysis in this article warns that the deflation is likely to be a country-specific phenomenon, requiring counter measures at the country level.
In 2008 and early-2009, most euro area countries joined in an internationally-coordinated stimulus of the global economy to ward off the menacing crisis. But by late-2009, especially after the Greek fiscal hole was revealed in October, the focus shifted to reducing public debt. This shift was encouraged by the global economy’s brief display of economic strength in 2010, which lulled policymakers everywhere into believing that the crisis was largely over. Since then, the euro area countries have single-mindedly pursued the objective of debt reduction.
There was reason to be concerned about the rapid increase in euro area public debt. But the policy pursued had serious unforeseen consequences. This article documents the unusually severe and persistent austerity, which has yet to make a dent in the debt burdens but has slowed growth and created deflationary tendencies. The emerging link between frustrated debt reduction efforts and deflation in the most stressed economies is particularly worrisome. Specifically, we find:
Because austerity caused growth rates to fall, public debt ratios today are much higher than in 2010 and private debt ratios are no lower
- Even making allowance for their high public debt-to-GDP ratios, euro area countries adopted significantly greater austerity than on average in other advanced economies.
- The austerity response within the euro area was remarkably similar across countries: Netherlands (with a relatively low public debt ratio) and Italy (with a high ratio) responded with equal aggressiveness.
- Because austerity caused growth rates to fall, public debt ratios today are much higher than in 2010 and private debt ratios are no lower.
- Public debt ratios have not only increased but they have exceeded forecasts. The higher-than-projected debt ratios have gone hand-in-hand with lower-than-projected inflation, highlighting the operation of a country-specific debt-deflation cycle. As an incomplete monetary union, the eurozone has no tools to deal with such country-specific pathologies.
Even within the eurozone’s operational constraints, the outcomes could have been better. Our findings reflect the balance in the deployment of macroeconomic management tools. In the euro area, the most proactive tool for addressing the crisis was fiscal policy pursued under the framework of the Stability and Growth Pact (the SGP). The unwavering commitment to fiscal austerity—despite its adverse growth consequences—arose from a “wait-and-watch” approach in the use of other macroeconomic policy instruments. Unlike their counterparts in the United States and the United Kingdom, the euro area authorities have remained unwilling to use monetary policy aggressively to provide economic stimulus—indeed, interest rates were raised at moments of critical weakness. And there has been only token effort—restricted to the most egregious cases—in dealing with unviable banks. Moreover, the euro area does not have well-developed systems to address household and personal financial distress (Claeys, Darvas and Wolff, 2014). Thus, despite occasional calls to make it more “flexible,” the traditional SGP emphasis on the perceived vulnerability arising from high public debt and the emphasis on deficit reduction have had long-lasting, possibly irreversible, effects.
Measuring Austerity
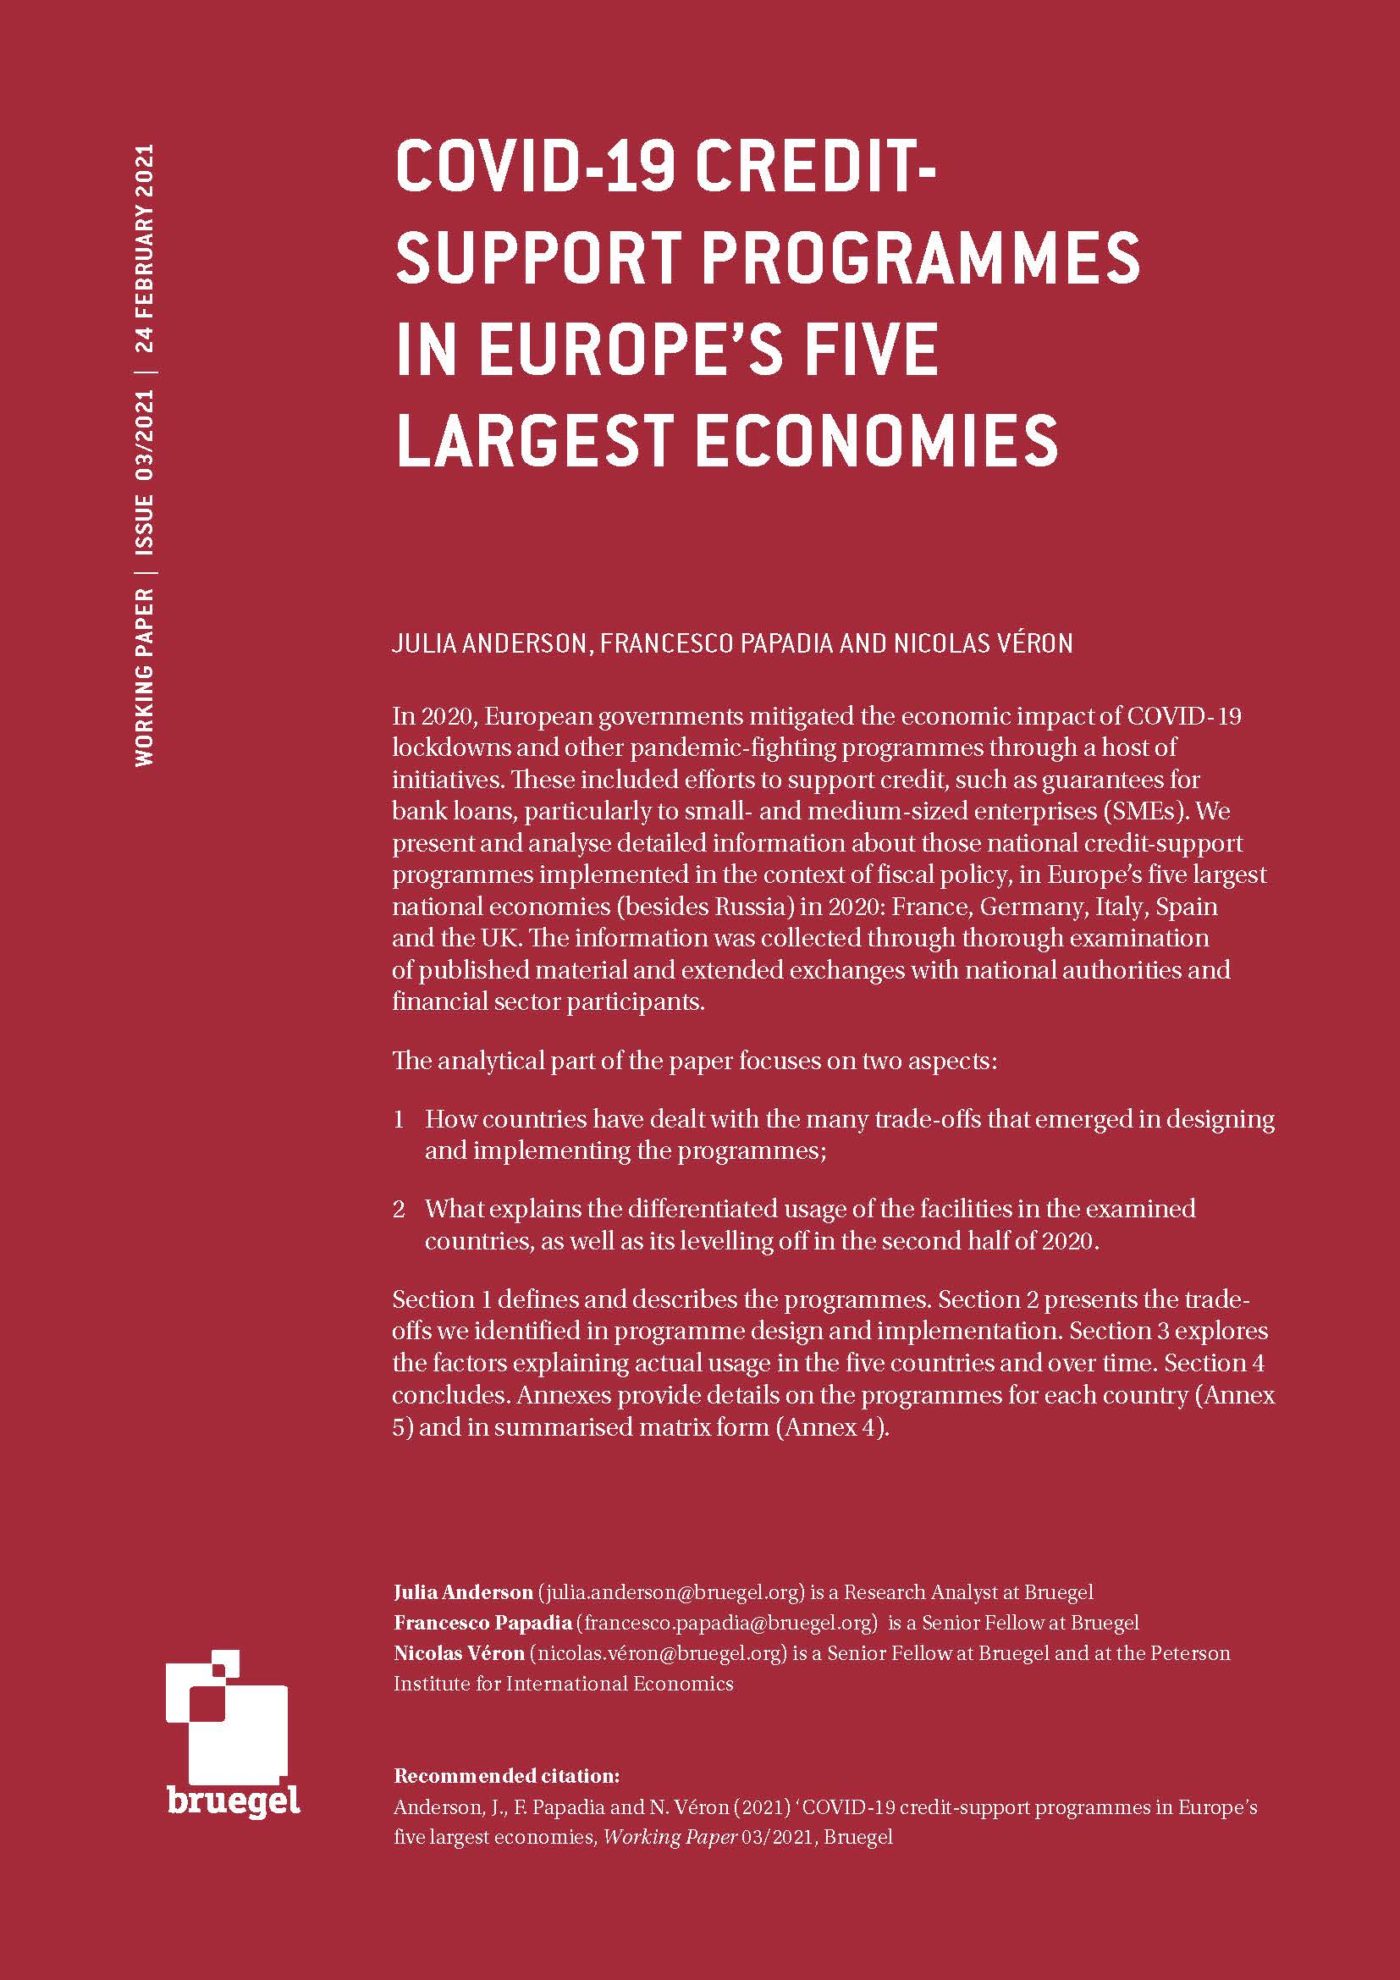
The crisis caused public debt ratios to rise sharply in much of the advanced world, and especially in the euro area (Figure 1). Hence, fiscal austerity to lower these ratios seemed prudent.
Because tax receipts fall and government expenditures for social safety nets rise, the fiscal balance decreases (equivalently, the fiscal deficit increases) when output falls below the economy’s potential. For this reason, the traditional measure of austerity is the increase in the structural fiscal balance, which is the improvement in the balance after making allowance for the shortfall due to the recessionary conditions.
The degree to which the primary budget surplus is increased (equivalently, the primary deficit is decreased) relative to the public debt ratio is a measure of the fiscal austerity that allows for the objective of lowering the debt-to-GDP ratio
But the change in the structural balance may also inappropriate when comparing two countries with very different debt ratios. A country with a higher debt ratio may be more concerned with the risk that the debt ratio may become unsustainable (spiral out of control). Debt sustainability requires that a rise in the public debt-to-GDP ratio be countered by an improvement in the primary budget balance (the balance that does not include interest expenses). The degree to which the primary budget surplus is increased (equivalently, the primary deficit is decreased) relative to the public debt ratio is a measure of the fiscal austerity that allows for the objective of lowering the debt-to-GDP ratio (Bohn, 1998).
In determining the relationship between the primary balance and the public debt-to-GDP ratio, it is necessary to control for the economy’s position relative to its potential. For, as noted above, if output is below potential, revenues will be depressed and income transfer and unemployment support payments will be elevated, depressing the primary balance. This procedure leads to the following equation, so-called “solvency equation:"
PBi,t = β0 + β1Di,t-1 + β2Ÿi,t + ci + εi,t
Where PBi,t is the primary balance, Di,i-1 is the (lagged) gross debt over GDP, Ÿi,t is the output gap. A higher β1—the metric of austerity—implies a stronger response to the debt ratio. The term c1 controls for country characteristics that do not change over time and εi,t is error term representing unmeasured variables.
Austerity in and outside the Euro Area
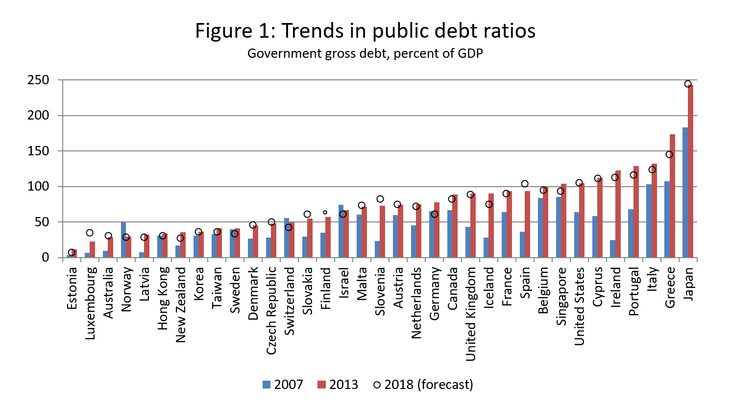
Regression results are reported in Table 1. A positive β1, the coefficient on the debt-to-GDP ratio, indicates that the rise in primary surplus in response to public debt will eventually achieve debt sustainability. A larger coefficient implies greater deference to the debt reduction objective.
Notes: The dependent variable is primary fiscal balance/GDP; t-statistics in brackets; *** p<0.01, ** p<0.05, * p<0.1. The data point for primary balance in 2010 in Ireland is dropped from regression (2) (2008-13), as that country had to deal with an extraordinarily high deficit (-27.2) due to banks bailouts.
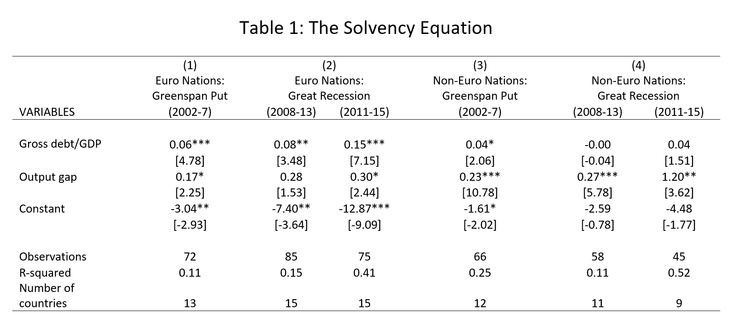
A finer view of the time variation in the responsiveness to debt, β1, is reported in Figure 2, which reports the coefficient on debt for each five-year period ending in that year.
Note: The rolling regressions are estimated as in Table 1, and the coefficient on debt-to-GDP ratio is for the year in which the five-year sample ends.
Before the crisis (2003-2007), the countries in the euro area increased their primary balance by about 0.06 percent of GDP for a 1 percent increase in their public debt ratios. There was no notable difference between the euro and non-euro countries during this period. During the years 2009 and 2010, the world was preoccupied a coordinated fiscal stimulus to stave off another Great Depression (Eichengreen and O’Rourke, 2012), and (quite rightly) the concern with public debt diminished. However, that concern reemerged soon thereafter and vigorously so in the euro area.
For the five-year period ending in 2013 (which includes the stimulus years), the rise in euro area primary balance was about 0.15 percent of GDP for a one-percent increase in the public debt-to-GDP ratio
For the five-year period ending in 2013 (which includes the stimulus years), Table 1 and Figure 2 show that the rise in euro area primary balance was about 0.15 percent of GDP for a one-percent increase in the public debt-to-GDP ratio. As the stimulus years are left behind, the preoccupation with debt is more starkly evident, and the coefficient on debt reached 0.20 in the five-year period ending in 2014. The concern with rising debt ratios also increased in other advanced economies, but to a much lower degree and with less persistence.
The Netherlands and Italy
In Figure 3, we ask if the responsiveness of the primary balance to public debt was similar across the euro area countries. The finding is represented in a so-called “partial plot,” the relationship between the primary balance and public debt, controlling for the output gap, for the period 2008-2013, as in Table 1. The figure is normalized so that the mean debt-to-GDP ratio for each country is zero. The dots mark the different member states in the different years, and show that the countries behaved more-or-less similarly around their mean debt ratios.
Note: Based on Table 1, column 2. The axes values are deviations from the country mean and are expressed as percentage of GDP.
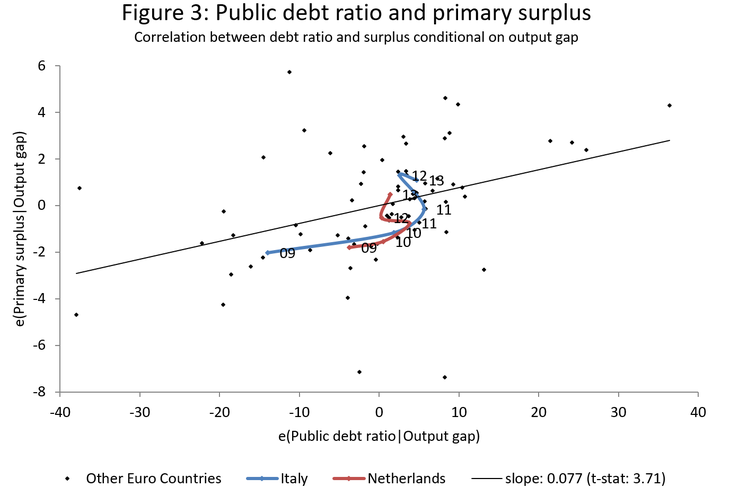
We focus on the Netherlands, where the public debt-to-GDP ratio in 2009 was 61 percent of GDP and Italy, where it was 116 percent of GDP. The lines connecting the dots for Italy (blue) and the Netherlands (red) tell us that, around their respective mean debt ratios, both countries displayed the same tendency to increase their primary balances in response to their rising debt ratios. This is also true if the same picture is examined for later years.
While fiscal austerity does reduce debt over a period of time, it has an almost immediate impact on reducing growth
But while fiscal austerity does reduce debt over a period of time, it has an almost immediate impact on reducing growth. Blanchard and Leigh (2013) have proposed a method to assess the growth impact of austerity. If a country’s GDP fell “unexpectedly” below its forecast, they suggest that a likely cause was an underestimation of the “fiscal multiplier”—the extent to which austerity hurts growth. Their paper reports extensive robustness tests to test for biases due to omitted variables and influential observations (and the spirit of their findings has been confirmed by several scholarly studies). They find that in the period 2010-2012, an extra 1 percent of GDP fiscal consolidation was correlated with between a 0.6 and 1.0 percentage shortfall in growth relative to the forecast.
We do not undertake new analysis in this regard, but present a graphical version of the Blanchard-Leigh relationship in Figure 4. Over the years 2011 to 2013, the unexpected growth of a country is the actual growth minus the growth that was projected in the IMF’s April 2011 World Economic Outlook. The unexpected growth of several advanced economies is plotted against the fiscal consolidation over the same period. The negative relationship shows that greater consolidation (austerity) was associated with actual growth that was lower than projected.
Note: The average annual unexpected growth is calculated as the difference between the average annual realized growth between 2011 and 2013, as reported in the 2014 WEO data release, and the average annual expected growth projected for the same period in the April 2011 WEO data release.
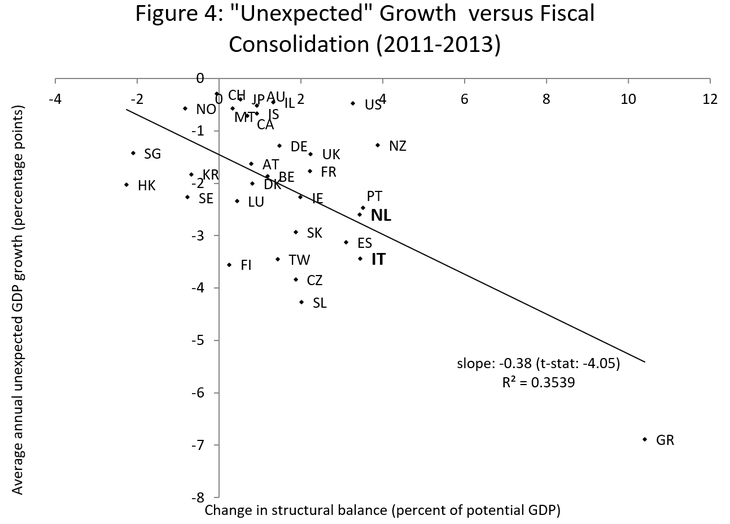
The growth shortfall in Italy and the Netherlands bore about the same proportion to austerity as in Greece
Notice that in Figure 4 the Netherlands and Italy fall on the regression line, which extends to Greece. Italy and (more so) the Netherlands had lower debt-to-GDP ratios than did Greece, so they undertook less austerity. However, the growth shortfall in Italy and the Netherlands bore about the same proportion to austerity as in Greece.
Notice also that the United States and, to a lesser extent, the United Kingdom, are above the regression line, implying that austerity was less costly in terms of foregone output growth. It is likely that the more aggressive monetary policy in these two countries and the early efforts to restore banks to health created alternative avenues of growth. In the euro area, monetary policy remained stodgy (Mody, 2014) and bank restructuring and recapitalization was delayed (Reichlin, 2014).
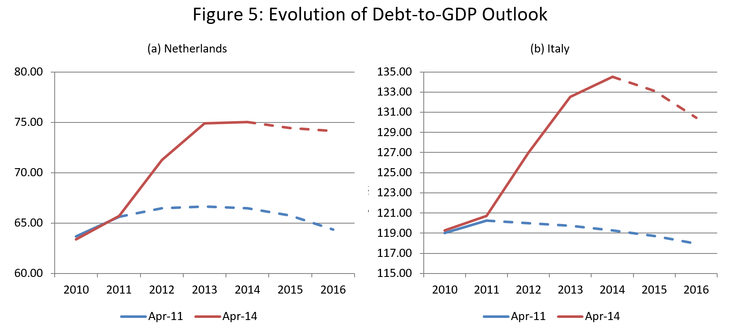
1 Recent revisions of the Italian data have lowered the entire trajectory of the Italian debt ratio by about 5 percentage points.
Because austerity in the euro area caused growth to slow, the debt ratios continued to rise—and faster than the projected. Figure 5 reports the time paths of debt ratios for the Netherlands and Italy, as seen in April 2011 (blue line) and April 2014 (red line). As austerity was stepped up in 2011, the projection was for debt ratios to stabilize. However, the ratios continued to rise. The debt ratio for the Netherlands now appears to be stabilizing, but that for Italy is unlikely to start falling as projected.1
Note: Dashed lines refer to projections at the time.
In sum, we see a consistent pattern of fiscal austerity, slower than expected growth, and higher than expected debt ratios.
Where do we stand?
Today, the Netherlands has to deal with a more serious public debt problem than in 2011 and with an undiminished private debt burden
For the Netherlands, the austerity was gratuitous. At its relatively low level of public debt ratio, the Netherlands could have afforded fiscal stimulus. GDP growth would have been higher and, it is possible, that the public debt ratio may have been lower. In the Netherlands, the costs of austerity were especially high because the private debt burden was substantial (since households had borrowed extensively to buy homes). In such a circumstance, a more stimulative fiscal policy is particularly desirable since the increased incomes help to pay down debt, which in turn opens the space for further spending and economic growth. Today, the Netherlands has to deal with a more serious public debt problem than in 2011 and with an undiminished private debt burden. Together, these will continue to dampen growth as the necessary deleveraging occurs over time.
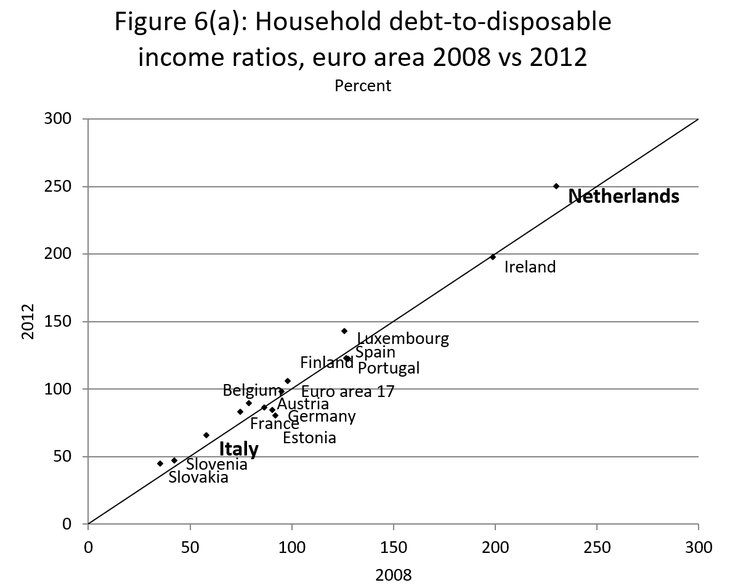
The Netherlands example has a more general echo through the euro area: even as the public debt ratios rose while fiscal austerity was pursued, the private debt burdens did not fall (Figure 6a). In contrast, household debt ratios fell across virtually every state in the United States (Figure 6b) While U.S. commentators have been critical of the insufficient policy effort to alleviate mortgage-related distress (see Mian and Sufi, 2014), the extent of such efforts was substantially greater than in the euro area.
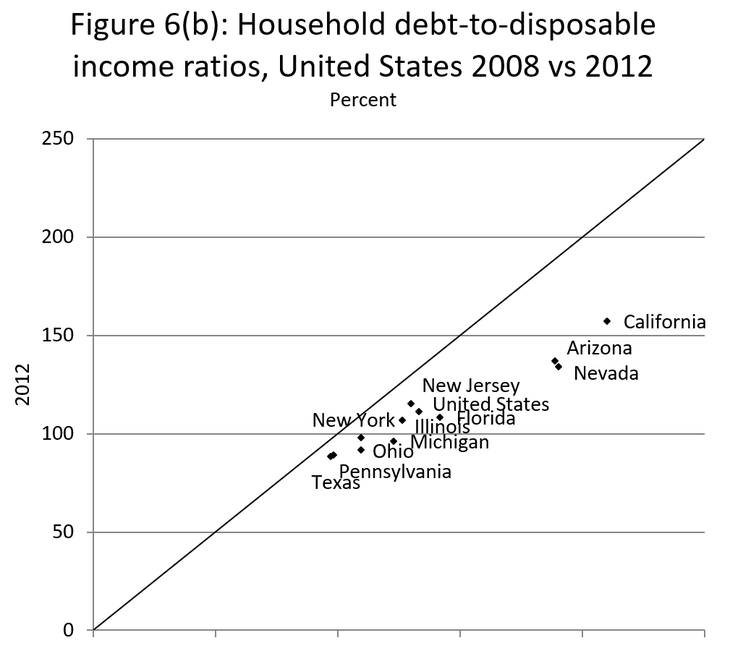
Today, the Italian debt ratio has just crossed 135 percent of GDP, and the warning applies with greater force
In Italy, with its high debt ratio, the options were more limited and more painful. In 2010, an IMF paper argued that the Italian debt ratio of over 120 percent of GDP had become unsustainable for practical purposes (Ostry et al, 2010). While the debt could, in principle, be reduced through fiscal consolidation, the authors warned that the austerity needed was so large even by Italian historical norms that it would be politically unacceptable. Today, the Italian debt ratio has just crossed 135 percent of GDP, and the warning applies with greater force.
The euro area authorities have ruled out the restructuring of public debt, except if a Greek-like situation repeats itself. Their concern is that restructuring would cause widespread contagion and damage to the European (and global) economies and financial systems. Thus, the strategy is to persevere with austerity. The projections of reduced debt ratios starting in 2015 rely overwhelmingly on the continuation of historically severe levels of austerity. The risk is that the primary surpluses will not materialize, growth will be compromised, and the debt ratios will continue to rise (see Darvas, 2013).
Debt and Deflation
Finally, we examine the relationship between debt and deflation. Figure 7 is a plot of the unexpected rise in debt-to-GDP ratio in the latest 2014 estimates versus those projected in 2011 against the unexpected fall in inflation over the same period. Notice that in virtually every country the debt ratio was higher than projected and inflation was lower. Moreover, these two errors are strongly correlated. A clear negative correlation emerges: higher levels of unexpected debt correspond to higher deflation. Once again, both Italy and The Netherlands fall along the regression line. The implication is that fiscal austerity had had far reaching unforeseen consequences: not only was growth lower (as described in Figure 4 above), but debt was higher, and the prospect of deflation was not even considered.
Note: The unexpected inflation is calculated as the difference between the realized inflation in 2014, as reported in the 2014 WEO data release, and the projected inflation for 2014, as reported in the 2011 WEO data release. The unexpected debt-to-GDP ratio is computed similarly. If Cyprus is included, the relationship is even stronger.
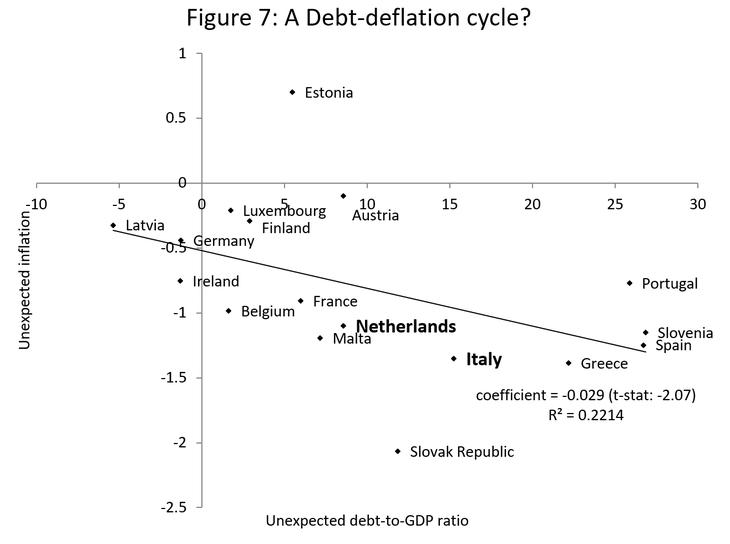
The importance of this finding is that the deflationary tendencies in the euro area are neither uniform nor randomly distributed. Rather, they are associated with the rise in debt: as debt has risen, the policy of austerity has thus far failed to rein in the desired increase, but it has weakened demand and, hence, reduced inflation rates. The latest data suggest that prices are actually falling in some of the high debt countries. And, since the cycle of higher debt and lower prices will not correct itself, a strong stimulatory policy with a country-specific focus will be needed.
Conclusions
A policy of more modest austerity everywhere in the eurozone, with active stimulus in a few countries, would have paid dividends
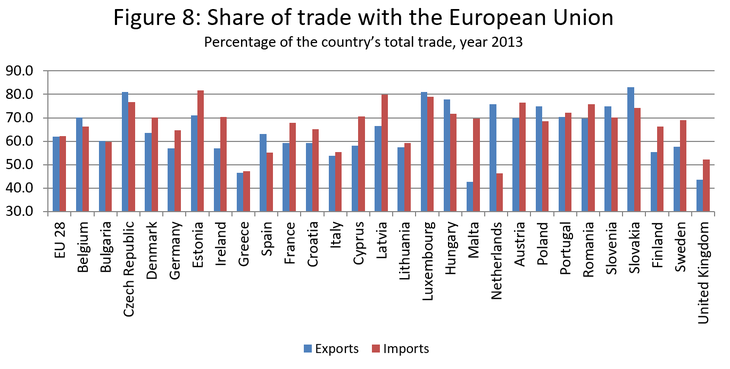
A policy of more modest austerity everywhere in the eurozone, with active stimulus in a few countries, would have paid dividends. Such an approach would have created a more stimulative overall fiscal policy stance throughout the euro and would have been particularly beneficial since European economies trade so much with each other (Figure 8): the boost to domestic demand would have been amplified through trade. The growth performance throughout the euro area would have been superior, which would have helped debt reduction with less austerity.
Instead, simultaneous austerity caused a drag on all countries. For the Netherlands, there was no trade-off: less austerity would have been unambiguously better. For Italy, an early effort to engineer a restructuring of public debt, while a controversial decision, would have allowed more space to lower the burden of austerity and create the conditions for stronger growth. Foregoing this choice would be particularly unfortunate if debt restructuring is eventually rendered inevitable.
Austerity might be driving the eurozone into a debt-deflation cycle, as higher debt and deflation feed off each other
The damage may not be over. Austerity might be driving the eurozone into a debt-deflation cycle, as higher debt and deflation feed off each other. Earlier this year, the ECB viewed the dip in inflation as temporary (Mody, 2014). Even now, ECB officials regard deflation to be unlikely. And the safeguards that they are glacially moving towards take a eurozone-wide view rather than differentiating across countries. Yet, the analysis in this article warns that the deflation is likely to be a country-specific phenomenon, requiring counter measures at the country level. The eurozone, by its construction, has no instruments to deal with a country debt-deflation threat.
We are very grateful to Ajai Chopra, Zsolt Darvas and Guntram Wolff for their helpful comments.
***
References
Blanchard, O.J., 2013, “Growth forecast errors and fiscal multipliers,” National Bureau of Economic Research Working Paper 18779.
Bohn, H., 1998, “The behavior of US public debt and deficits,” Quarterly journal of economics, 949-963.
Claeys, G., Darvas, Z., & Wolff, G. B., 2014, “Benefits and drawbacks of European unemployment insurance,” Bruegel Policy Brief, Bruegel.
Darvas, Z., 2013, “The Euro Area’s tightrope walk – debt and competitiveness in Italy and Spain,” Policy Contribution, Bruegel.
Eichengreen, B. and O’Rourke, K. H. (2009). A tale of two depressions. VoxEu
Mian, A., & Sufi, A., 2014, “House of Debt,” Chicago: The University of Chicago Press.
Mody, A., 2014, “The ECB is much too stodgy.”
Ostry, J. D., et al., 2010, “Fiscal space,” International Monetary Fund, Research Department.
Reichlin, L., 2014, “Monetary policy and banks in the Euro Area: the tale of two crises,” Journal of Macroeconomics, 39, 387-400.
Read more from Ashoka Mody on Italy
“It’s true, Italy breaks your heart.”
Republishing and referencing
Bruegel considers itself a public good and takes no institutional standpoint. Anyone is free to republish and/or quote this post without prior consent. Please provide a full reference, clearly stating Bruegel and the relevant author as the source, and include a prominent hyperlink to the original post.