Blog Post
Where does the youth exodus come from?
Intra-EU migration increased before the crisis, especially into booming countries like Ireland and Spain. What happened during the crisis?
In normal times labour mobility within an economic area fosters the more efficient allocation of resources. But it can also help when there is an economic shock with asymmetric impacts throughout the area. In such a case, migration allows people from hard-hit areas to move to less-hit areas, with the potential to reduce unemployment overall. If people who left send money home, frequently travel home to consume, and eventually return a few years later after obtaining valuable experience while working abroad, then migration is good news.
But it also has potential downsides. It can undermine long-term economic growth by reducing the quantity of labour, and also the quality if the most talented people leave. It is typically the young who move, thereby undermining the sustainability of the social security system. Exoduses also depress consumption (and consequently, consumption taxes), and housing prices if the emigrants wish to sell or rent out their properties back home.
It has long been know that mobility in the European Union is much lower than in the United States – a reason why many academics concluded that regions of Europe form a less effective single currency area than US states (see for example a 1995 article by Jörg Decressin and Antonio Fatás). Yet intra-EU migration increased before the crisis, especially into booming countries like Ireland and Spain. What happened during the crisis? Table 1 shows the aggregate data for twelve European countries (see note 1 at the end on the data we use). In Lithuania and Latvia, two hard-hit countries, population declined by more than 10 percent between January 2008 and January 2012, with migration playing a decisive role. (Note: data for the third Baltic country, Estonia has to be wrong so we do not report it; see note 2 at the end). Net emigration was less significant from Iceland, Portugal and Ireland, and there was even net immigration into Greece and Spain, and into some ‘northern’ EU countries with lower unemployment rates.
Table 1: Population change from 1 January 2008 to 1 January 2012
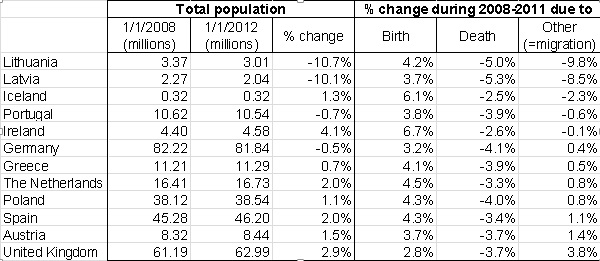
Note: countries are ordered according to the percent contribution of migration to population change. Source: author’s calculation using Eurostat data. See note 1 at the end for details on the data.
Correction: This table was updated on 10 June 2013, because in the original version the number for the contribution of deaths to UK’s population change was incorrect
The right-hand half of Table 1 refers to the 2008-11 period, during which there was a change in migration patterns between euro-area members. In southern Europe there was net immigration in 2008 and net emigration in 2011, while Germany experienced the opposite. Yet even in 2011, net emigration rates were low from Spain and Greece, about 0.1 percent of total population. In Portugal, net emigration was 0.2 percent in 2011, in Ireland it was 0.7 percent; all are still below the 1.1-1.3 percent net emigration rates in the two Baltic countries in this year.
The total population figures hide important generational differences. Figure 1 below shows the percent change in each age group for each country not due to death (ie due to migration, and possible data errors). For Latvia, for example, the panel shows that 19 percent of 25-year old people who were residing in Latvia in January 2008 left the country between 2008-2011. In Lithuania, net emigration by young people was even higher, more than one quarter in certain age groups. These two countries really suffered from an exodus of the young. About 6-8 percent of young people left Iceland and Portugal, and somewhat fewer left Ireland.There was net emigration from southern euro-area countries in 2011 as indicated by Figure 2 (it is likely that net emigration from these countries rose in 2012, but data is available only till 2011), yet the rates are very small, which is striking in light of very high youth unemployment rates (Figure 3).
On the other hand, countries with better labour market situations received a lot of young people: the number of 20-year olds increased by about 9 percent in the United Kingdom, 7 percent in Austria and 4-5 percent in Germany and the Netherlands. Not surprisingly, older people tend to move less: in the four receiving countries there was a rather small net migration of people older than 40.
Do migrants send more money home? Unfortunately, this is not the case, except in Spain. Table 2 shows that the net inflow of worker’s remittances has gradually declined in Greece since 2007, and was more or less stable in Lithuania up to 2011, but declined in 2012. Data for three other countries with high emigration rates (Latvia, Ireland and Iceland) is unfortunately not available. But in three main receiving countries, Austria, Germany and the Netherlands, the net outflow of worker’s remittances was rather stable, suggesting that the net immigration of the young people into those countries has not led to increased transfers to their homelands.
Overall, there was a youth exodus from Latvia and Lithuania, with 20-25 percent of young people leaving, which is really dramatic and underlines the pain these countries went through during the past few years. The recent fall in their youth unemployment rates, which are still higher than 20 percent, must be seen in this light. People are less mobile in the south of the euro area, which is puzzling given the extremely high youth unemployment rates. Yet despite increased immigration into countries with healthier labour markets, net remittance outflows from Germany, Austria and the Netherlands have not increased. These findings suggest that migration has not so far greatly helped to reduce the social pain in the south, while the youth exodus from the Baltics raises questions about long-term sustainability.
Figure 1: Net migration during 2008-2011 (i.e. change in population not due to death or birth), percent of the 1 January 2008 number of people in the age cohort
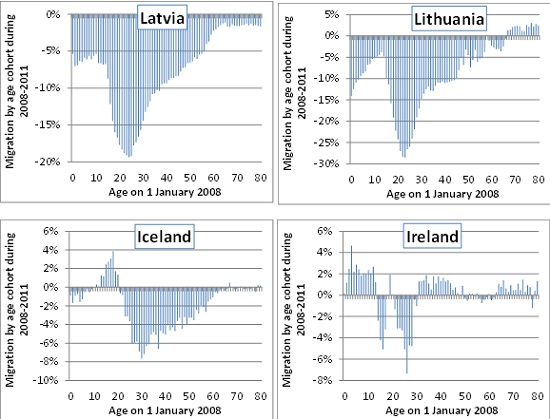

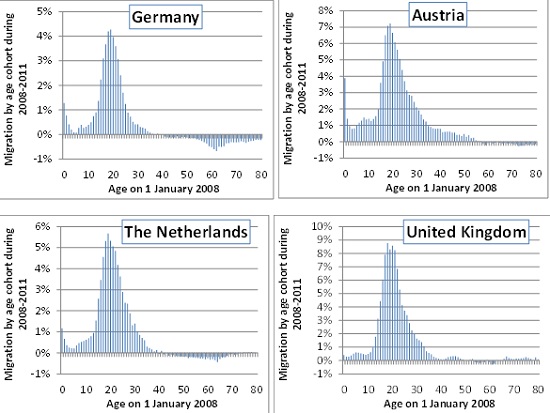
Source: Author’s calculation using Eurostat as described in note 1 at the end.
Figure 2: Net migration during 2011 (i.e. change in population not due to death or birth), percent of the 1 January 2011 people in the age cohort

Source: Author’s calculation using Eurostat as described in note 1 at the end.
Figure 3: Youth unemployment rate (seasonally adjusted, percent), January 2007 – April 2013
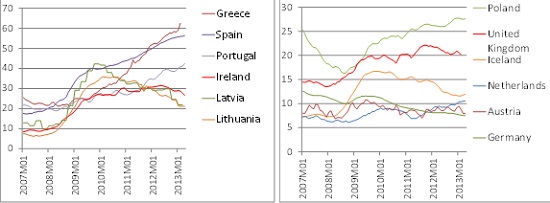
Source: Eurostat. Note: data ends in February 2013 for Greece and the UK and in March 2013 for Latvia.
Table 2: Worker’s remittances, net (€ billions)
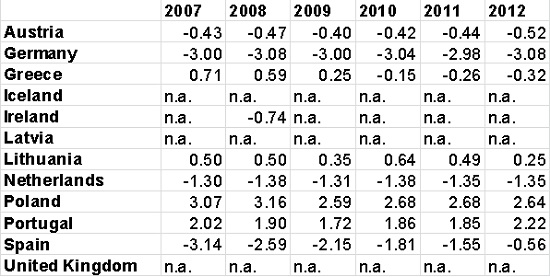
Source: Eurostat.
Notes
[1] Data: it is difficult to get reliable data on migration. Instead, we used population and death data by age cohorts (less than 1-year old, 1-year old, 2-year old, …, 80-year old; we do not consider people older than 80) to get an indirect estimate of migration (the source of all data is Eurostat). For example, when we know the number of 20-year olds on 1 January 2008, the number of 21-year olds on 1 January 2009, and the number of deaths by those who reached (or were supposed to reach) 21 during 2008, we can estimate the number of net migrants who were 20-years old on 1 January 2008, and who left during 2008. Births matter for the total population, but obviously not for, eg the cohort of 20-year old people. As we checked, this indirect estimate was sometimes close to officially reported migration data (in the case of the UK, for example), but in some cases there were major differences (eg Latvia).
For the UK, migration data indicates the net arrival of 812,357 people into the UK during 2008-11, while our indirect estimate from population and death data suggest 842,839 people, in all age groups up to 80 years old. The difference between the two numbers is 4 percent. This difference is relatively small, and may even be explained by a data assumption we had to make: death data by cohorts was available only till 2010 and for 2011 we assumed that the same number of people died as in 2010 in each cohort.
But for Latvia there is a major difference. Migration data indicates the net departure 38,301 people during 2008-2011, while our indirect estimate from population and death statistics suggest 190,170 people, in all age groups up to 80 years old.
[2] Population and/or death data has to be wrong for Estonia: for each age cohort from 1-year old to 70-year old, the change in population from one year to the next equals the number of deaths of the particular age cohort (in a few cases the discrepancy is one person), implying zero migration in all age cohorts, in each year between 2008 and 2011. This is inconceivable, since the youth unemployment rate exceeded 40 percent in early 2010.
Republishing and referencing
Bruegel considers itself a public good and takes no institutional standpoint. Anyone is free to republish and/or quote this post without prior consent. Please provide a full reference, clearly stating Bruegel and the relevant author as the source, and include a prominent hyperlink to the original post.