Bruegel datasets
European natural gas imports
Last update: 6 July 2022
by Georg Zachmann, Giovanni Sgaravatti, Ben McWilliams
This dataset will be updated regularly.
This dataset aggregates daily data on European natural gas import flows and storage levels. Acute interest has developed in these indicators in response to soaring energy prices which are largely due to a tight natural gas market. The behaviour of Gazprom in using (or not using) specific supply routes and storage facilities has been the focus of public attention.
We hope this dataset – which we will regularly update – provides some easily usable insight into the current status of European natural gas supply situation.
To get access to the data, please get in contact with [email protected].
Figure 1 shows weekly extra-EU imports of natural gas for 2021, compared with weekly minimum and maximum import values for the period 2015-2020. By selecting from the dropdown, the figure shows total imports but also imports exclusively from Russia, Norway, Algeria, and via liquefied natural gas (gas transported by ship from around the world).
The map (Figure 2) displays the most relevant pipeline import routes into the EU. The largest share of gas is delivered from Russia via four distinct corridors (Nord Stream, Yamal (via Poland), Ukraine, and Turkstream (via Turkey). These different Russian gas routes are at the heart of current geopolitical tensions surrounding the completion of Nord Stream II. Figure 3 shows weekly import data via each of these routes, again comparing to the minimum and maximum values from the period 2015-2020.
Figure 2: Main EU Natural Gas Imports routes covered in our analysis
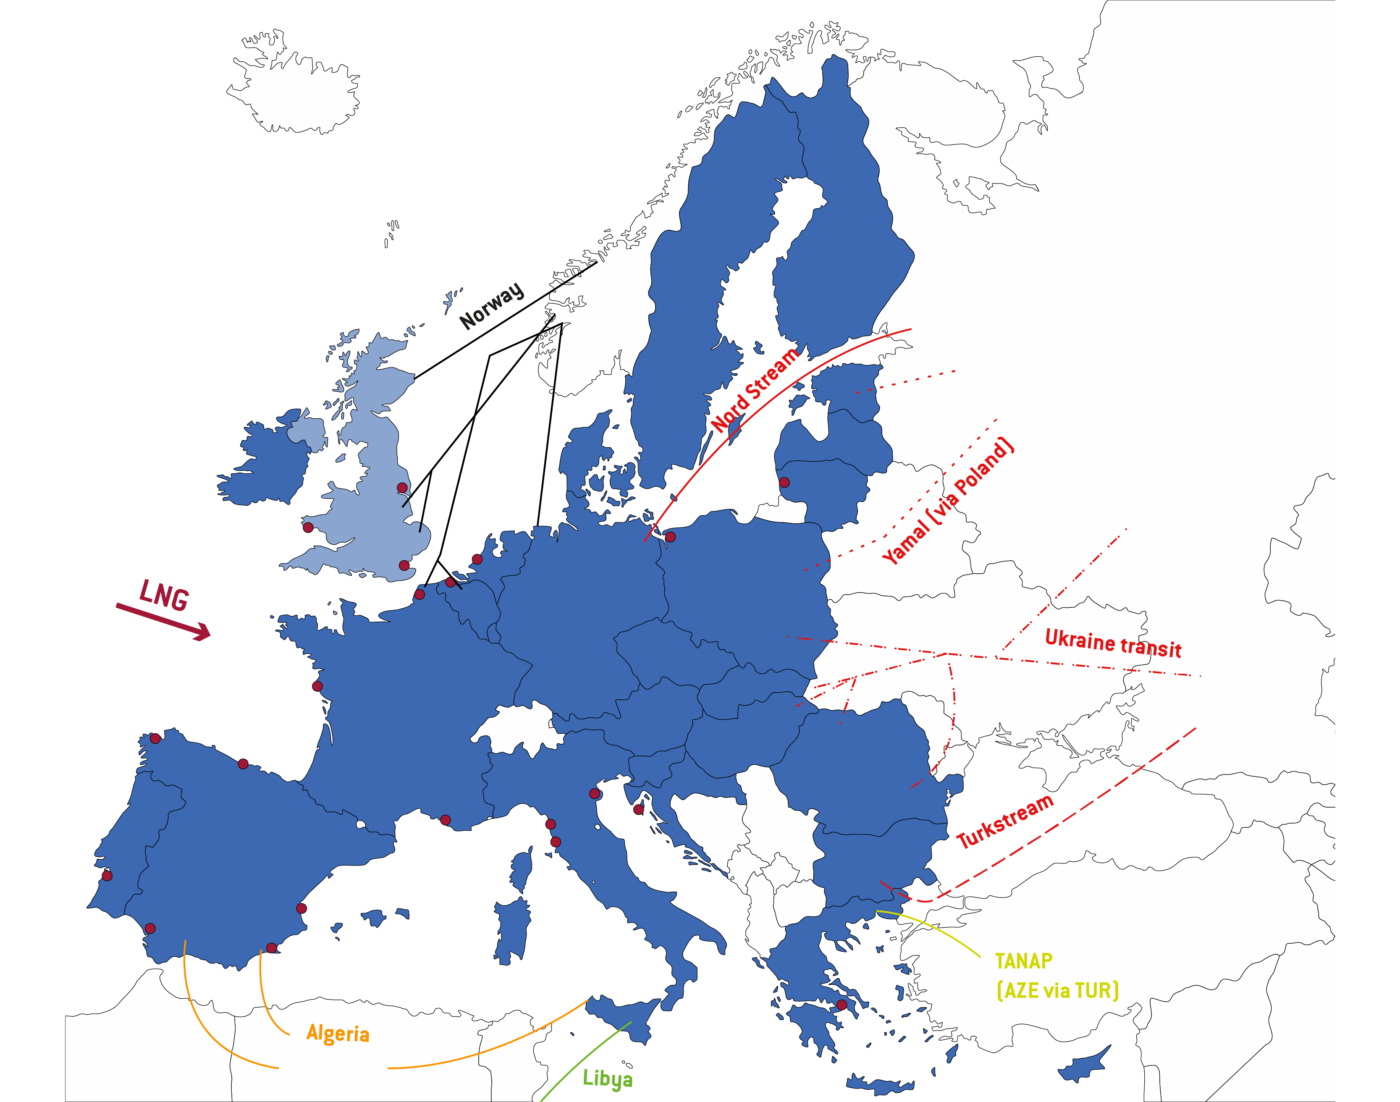
Source: Bruegel
Figure 4 shows actual daily imports and storage levels for the last 30 days. Imports are split by Russian routes, as well as shown for Norway, Algeria, and LNG.
Alongside import volumes, the levels of storage within the EU’s borders are key for providing (or not) reassurance to markets.
In Figure 5, we provide data on current weekly levels of storage in the EU.
In the first tab of Figure 6, we display the current storage level and the relative maximum storage capacity by country. In the second tab, we show the filling occurred in the last 30 days along the 80% target to be achieved by November 2022 behind the European Commission’s recommendation.
Recommended citation:
McWilliams, B., G. Sgaravatti, G. Zachmann (2021) ‘European natural gas imports’, Bruegel Datasets, first published 29 October, available at https://wordpress.bruegel.org/publications/datasets/european-natural-gas-imports/
technical appendix
We aggregate the data using the API provided by Entsog. To ensure consistency, we construct our dataset matching import flows to those provided by the IEA. We perform quality checks by comparing each import point with the IEA. We include all extra-EU trading points, apart from those with Switzerland and the Balkans.
Appendix A1 explains how we match ENTSOG points with IEA data, and then attribute these points to the exporting country/route.
For storage levels, we used APIs provided by Gas Infrastructure Europe that can be found on the AGSI+ website.
Gazprom storage data show the aggregated values for the storage points of Jemgum and Rehden in Germany and Haidach in Austria. These are the three EU storage facilities with a majority equity stake owned by Gazprom. Apart from these, Gazprom also has equity stakes in Damborice (in the Czech Republic) and in Etzel and Katharina (in Germany). Moreover, Gazprom also has shares of capacity at other storage points in the EU (1.9 bcm/4.1 bcm in Bergermee for example), however, in this dataset we aggregate data only coming from facilities in which Gazprom has a majority stake. The methodology changed on 15 December 2021.
Appendix A2 shows the 2021 dates which correspond to the week numbers shown in the figures.
The data is subject to the author’s best interpretation of that provided by Entsog.
data policy
This page provides a number of Bruegel datasets for public use. Users can freely use our data in its unchanged form or after any transformation for any purpose and can freely distribute it, provided that proper attribution is made to the source, but not in any way that suggests that Bruegel endorses the user or their use of the data.
Comments to improve the coverage and the estimates are welcome. Please send your comments to [email protected]